I tried but I can't read through 9 pages of this drivel. This is all about control and money. In Uganda, what we look at as a third world country, there have been 334 deaths and none in almost two weeks. What are they doing right? Their population is 46,783,614 which is about one seventh of ours. That would mean that we should only have 2338 deaths in our country. Coumo killed more grandmas and grandpas with his bad decisions than that. I am not speculating the reason but you can look up the numbers for any country yourself on www.worldmeters.info. Take a look at Iceland, 29 deaths. The people who brought up the fact that this is the first RNA based vaccine, which will bond with your DNA, and forever alter your genome are at least reading and not trusting the news. You have to be nuts to get vaccinated with this from any vendor. It's experimental. Go get a written guarantee about what the vaccine will do for you and then come talk to me.
Covid-19 Vaccination
- Thread starter sail sfbay
- Start date
That’s not quite correct but this isn’t the place to debate opinions. I’ll leave it suggesting people read the physiological response the vaccine actually triggers, which will bond with your DNA, and forever alter your genome .... .

This isn't the place to debate it and yet there are ten pages of debate. LOLThat’s not quite correct but this isn’t the place to debate opinions. I’ll leave it suggesting people read the physiological response the vaccine actually triggers
The vaccine does not bond with or in any other way affect DNA or alter your genome. Whether or not that’s the case is not a matter of watching the news, it’s just the science.. The people who brought up the fact that this is the first RNA based vaccine, which will bond with your DNA, and forever alter your genome are at least reading and not trusting the news.
Keep searching for what it does. You saying no does not make my statement false. You will be just like any GMO that Monsanto, the devil, has created.The vaccine does not bond with or in any other way affect DNA or alter your genome. Whether or not that’s the case is not a matter of watching the news, it’s just the science.
Science has nothing to do with most of the fear and all of the “malarkey”.The vaccine does not bond with or in any other way affect DNA or alter your genome. Whether or not that’s the case is not a matter of watching the news, it’s just the science.
Most of what you have said in this post is just wrong. If you are going to make statements like these then you need to provide reliable sources to back up your claims.I tried but I can't read through 9 pages of this drivel. This is all about control and money. In Uganda, what we look at as a third world country, there have been 334 deaths and none in almost two weeks. What are they doing right? Their population is 46,783,614 which is about one seventh of ours. That would mean that we should only have 2338 deaths in our countr
. I am not speculating the reason but you can look up the numbers for any country yourself on www.worldmeters.info. Take a look at Iceland, 29 deaths. The people who brought up the fact that this is the first RNA based vaccine, which will bond with your DNA, and forever alter your genome are at least reading and not trusting the news. You have to be nuts to get vaccinated with this from any vendor. It's experimental. Go get a written guarantee about what the vaccine will do for you and then come talk to me.
Here's a good example of your speculative and inaccurate statements:
Here's the reality:Coumo killed more grandmas and grandpas with his bad decisions than that.

Why ‘Cuomo’s death order’ didn’t really cause NY’s nursing home carnage. A reality check
The March 25 order may have been ill-advised, experts say, but it wasn't a major cause of deaths.
Yes, there is a question about why some African nations are not experiencing the same infection rate as the US and other developed nations. Rather than just spouting headlines, you might want to actually read the article and understand why the data might be misleading.In Uganda, what we look at as a third world country, there have been 334 deaths and none in almost two weeks. What are they doing right?
There is a lot of money to be made by spreading lies and misinformation. Rush Limbaugh didn't die a poor man, he was laughing all the way to the grave. Alex Jones makes a lot of money selling sham cures for what ails you. The Murdoch family is very rich, not by supporting good journalism but being the mouthpiece of the disinformation market.This is all about control and money.
@uncledom, I am more than willing to read any articles that are science based and published by respected periodicals that support the positions you state. However, all opinions are not equal, some are quite worthless and destructive. If you have data to support your opinions please share it, I would enjoy reading and responding to it.
However, if your sources are places like InfoWars, Fox News, ONAN, and such, please save your energy and keep them to yourself.
Last edited:
Perception bias is pervasive throughout your link regarding Cuomo's culpability. If intended as a defensive against his negligence, it fails miserably in denying his sending thousands of "typhoid Marys" into ALFs.Here's the reality:
Why ‘Cuomo’s death order’ didn’t really cause NY’s nursing home carnage. A reality check
The March 25 order may have been ill-advised, experts say, but it wasn't a major cause of deaths.www.syracuse.com
However, if your sources are places like InfoWars, Fox News, ONAN, and such, please save your energy and keep them to yourself.
As to unbiased and objective news sources, that you seemingly singled out for criticism a few while clearly omitting others displays your bias too.
I don’t mean to imply bias is a bad thing; only that it needs to be recognized in all of us. It’s how we deal with it that is important.
Last edited:
Yes, I noticed a lot of claims without supporting evidence. Not arguing if the premise is true or not, just pointing out that one should be very skeptical when you read statements people make without any real reasoning based on facts. Today's news is all about spin. Political marketing is what is dividing us as a country. Politics is marketed such that any disagreement is considered hatred for a particular people group. Ironically that in itself has created a self righteous hatred for anyone who disagrees.
Just got my one and done dose of J&J vaccine 24 hrs ago. No fuss, no muss, in and out. No side effects as yet. Not even a sore arm. My GF is still trying to score her's. They are not making it easy here in Fl. unless you are a rich GOP donor it seems. I just happened to get on the Wal-mart site at the right time. My GF tried with no luck. Same with the Publix site. Even with the vaccine, keep wearing yer damn masks. If not for you then for others. The universe thanks you.
Listening to the news it sounds like a vaccination may become a prerequisite for international travel. At least a lot of countries are talking about it.
We received our first of 2 jabs today. I'm finding the side effects are quite profound.
First, I'm thinking about the future, when I'm not stuck in this weird box that is getting old after a year.
Everywhere I look, the playing field has changed. Remote work, zoom, real estate, cities to rural coasts like mine have reset in various ways, some more than others. People, millions, all coming out the other side.
My coffee shop down the street to NYC, they've all gone through this box and nothing, nothing, will come out the same on the other side.
Weirdly, most everything I see on the other side, looks better, a little better.
I can't remember which arm I was shot in, maybe I'm hallucinating?
This is a statue in Lucca, Italy. This is how I feel.
Covid has been a transitional event. No, we're not going to be the same. There will be good changes and others not so good. People will migrate, we'll work differently, vacation areas will become permanent residencies and on and on. A lot of it is unpredictable. But we're not going back to Pre-Covid.... Everywhere I look, the playing field has changed. Remote work, zoom, real estate, cities to rural coasts like mine have reset in various ways, some more than others. People, millions, all coming out the other side...
Let me begin by saying I'm neither attacking or defending Cuomo. The article I cited is not particularly well written, however, it does present opposing views and offers appropriate critiques. For example this quote from the Post-Standard Article:Perception bias is pervasive throughout your link regarding Cuomo's culpability. If intended as a defensive against his negligence, it fails miserably in denying his sending thousands of "typhoid Marys" into ALFs.
As to unbiased and objective news sources, that you seemingly singled out for criticism a few while clearly omitting others displays your bias too.
I don’t mean to imply bias is a bad thing; only that it needs to be recognized in all of us. It’s how we deal with it that is important.
It is worth noting and the P-S article notes the Empire Center is a conservative policy center in NY. It is accurately stating the limitation of this study. This is commendable. The P-S article goes on to identify other factors that could have an equal or greater effect on nursing home deaths that may be clouding the data. Again, this is commendable as the author is trying to present a balanced and fair report.“It’s important to be cautious about reading too much into it,’' said Bill Hammond, senior fellow for health policy at the Empire Center. “First of all, correlation does not equal causation. There are confounding factors that could be clouding the situation.’'
I am either blessed or cursed with more knowledge of advanced statistics than the average person, having taken and passed some 18 graduate credits in inferential statices, including multiple regressions, which the Empire Center's report used. With this background, I have a different understanding of the data, and frankly the data is pretty unconvincing for several reasons.
The data is correlational, i.e., it shows a correlation between the policy and returning covid patients to SNF. While tempting to believe that one caused the other, any one who took an entry level course in statistical analysis learns correlation does not imply causation, it simply demonstrates that both variables (deaths and readmits) vary in the same direction. There may or may not be a relationship. A good example of this type of data is touted in late January every year when forecasters remind us of the relationship between the Stock Market and who wins the Super Bowl.
The Empire Center data shows a "statistically signifiant" relationship between readmits and deaths. This sounds more impressive than it is for a couple of reasons. First, statistically significant relationship only states the probability of obtaining a correlation given the data and the size of the data set. Notably, the EC Report does not indicate at what level significance was established, it could be as high as .1% or as low as 15% That is the range typically used by researchers, with very high levels of sigificance (.1%, ) for important and risky decisions, such as in drug studies or vaccine studies to very low levels fo significance (15%) for less critical or exploratory studies, sometimes known as fishing expeditions.
When conducting a correlational study the larger the group that is studied, the easier it is to find statistical relationships and significance is option with a much lower correlation. If the data set reaches hundreds and thousands of data points, the correlation value can be quite low and still reach statistical significance.
Mathematically the correlation is the square root of the variance. So what does that mean? In correlational studies we often talk about shared variance, or what unknown factors are involved in arriving at the correlation. If you recall Venn diagrams, there are 2 or more overlapping circles, the area of overlap is the shared variance. To give an example, a popular type of study and part of the validation procedure for achievement tests and IQ tests is a correlational study to see how they relate. Typically these studies yield a correlation of about
The EC Report states:
First, all correlation values fall between 1 and -1, with a value of 0 meaning there is no correlation. A value of .09 is very close to 0 which suggests there is very little relationship between between deaths and readmits. The shared variance is .0081 or less than 1% of what ever caused the deaths. A truly trivial amount.The data show that each new admission of a COVID-positive patient correlated with .09 additional deaths, with a margin of error (MOE) of plus or minus 0.05.
To go back to my original point, media with an agenda, like Fox, ONAN, Sinclair Broadcasting, all the Right Wing Talk show hosts, will never go into depth about or accurately report findings like this. At least the P-S article tried to report it, but the level of statistical sophistication is beyond that of most reporters.
Finally, the media with a known bias will never report these paragraphs from the EC Report:
Edit: See strike through above. Just a typo, .y is a meaningless term, it should have been .7. Proofreading is not one of my strong suits.As with any such analysis, the results should be viewed with caution. Even a statistically significant correlation between two factors does not necessarily mean that one caused the other. The available data were also limited in potentially important ways—such as the lack of dates for the COVID-positive admissions.
Other possibly relevant factors, such as the relative quality of care provided in the nursing homes and the average acuity of their patients’ condition, were beyond the scope of this review. Moreover, the data do not clarify how many of the patients admitted to a nursing home from a hospital later died in the nursing home, which would add to the home’s death count even if the patient in question did not spread the virus there. (emphasis added)

Last edited:
Apparently, there are 5,600,000 “rich Republican donors” in Florida.. They are not making it easy here in Fl. unless you are a rich GOP donor it seems.
We got our vaccinations 2 months ago and are mere middle class independents. Must have snuck through...
Too bad we can’t all paste this on our mouths and typing fingers.. Politics is marketed such that any disagreement is considered hatred for a particular people group. Ironically that in itself has created a self righteous hatred for anyone who disagrees.
Can’t recall who first said this and I’m paraphrasing but - “ strong minds discuss ideas. Weak minds discuss people.”
Oh we will. Either by vaccine, naturally or death, but we will.My concern is will the US actually achieve herd immunity?...
These articles are interesting. The WSJ article is behind a Paywall, but you can read the first few paragraphs. The other pieces go into more depth.
 www.wsj.com
 www.nytimes.com
 www.cnn.com
WSJ News Exclusive | Russian Disinformation Campaign Aims to Undermine Confidence in Pfizer, Other Covid-19 Vaccines, U.S. Officials Say
Russian intelligence agencies are trying to undermine confidence in Pfizer’s and other Western coronavirus vaccines, using online publications that have questioned the vaccines’ development and safety, U.S. officials said.
www.wsj.com
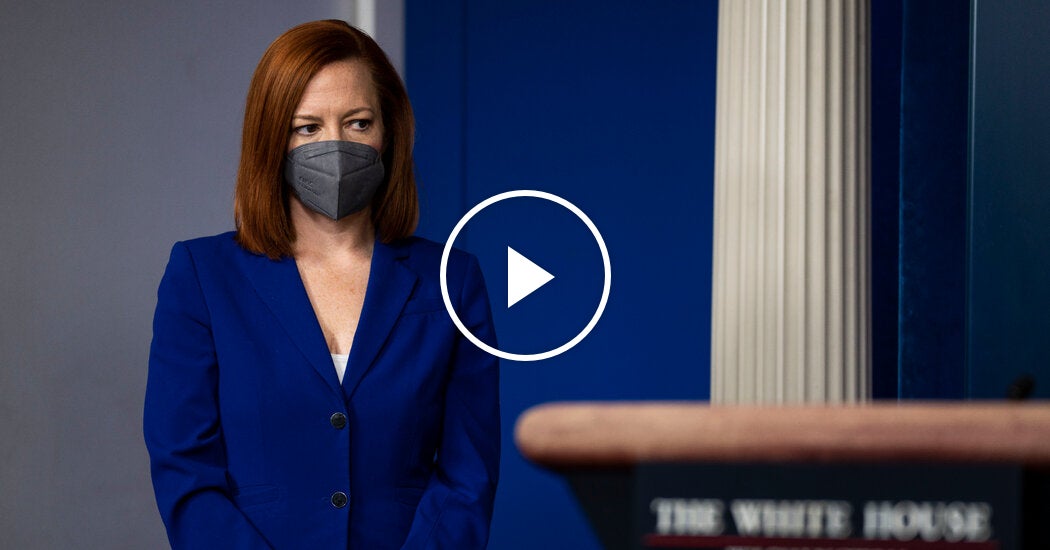
Video: White House ‘Aware’ of Russian Vaccine Disinformation Efforts
The White House press secretary, Jen Psaki, said on Monday that “we will fight with every tool” to combat Russia’s efforts to spread disinformation about the Moderna and Pfizer coronavirus vaccines.
Russian disinformation campaign working to undermine confidence in Covid-19 vaccines used in US
Online platforms directed by Russian intelligence are spreading disinformation about two of the coronavirus vaccines being used in the US, a State Department spokesperson confirmed to CNN on Sunday.