high water?
- Thread starter jon hansen
- Start date
Yes I think many will need to sandbag again this year. The graph below and the recent IJC news release both bring some optimism that it might not be as bad as it was looking a few months ago. I hope they are right.Was talking to family who live on the St. Lawrence at Brockville and they have water over their dock, are about to put the third sump pump in their basement and are thinking about sand bagging their house.
Strong front moving through today with 20k + onshore right now. Dock is awash.
I've watched this tread bouncing around. It contains both empirical and surmised reasons for increasing water heights on the Great Lakes. Do I understand this correctly? If so, is there no law or treaty that that regulates the maximum and minimum heights above sea level for the 5 lakes? Since there are no melting icebergs and damn few glaciers feeding this, can it be asserted that these rising levels are driven by storm related run off ? Of course it could be worse, the lakes could be dropping at precipitous rates.
No glaciers, just snow and rain feeding the lakes. It takes a crystal ball with a 12 month window in it to accurately predict the water heights. Snow melt can be somewhat predicted but the snow is mostly gone by this point so it's all about the rain now.
Although the water surface area of the Great Lakes and St Lawrence river is massive the "inflow" is really from the entire basin. To give a little perspective:I've watched this tread bouncing around. It contains both empirical and surmised reasons for increasing water heights on the Great Lakes. Do I understand this correctly? If so, is there no law or treaty that that regulates the maximum and minimum heights above sea level for the 5 lakes? Since there are no melting icebergs and damn few glaciers feeding this, can it be asserted that these rising levels are driven by storm related run off ? Of course it could be worse, the lakes could be dropping at precipitous rates.
So pretty big area and very little of it under man made control.
There is a history of both low and high periods but the last several years are setting new records for high causing significant damage., hence the thread
A portion of the precipitation is absorbed by the land, some evaporates and possibly moves out of the basin etc but a significant percentage likely ends up either in one of the GL's or in the St Lawrence directly. City's, factories, farming etc. draw water out but a lot of that likely cycles back after "use" so the net impact probably isn't all that great. The two major impacts decreasing levels are outflow down the St Lawrence to the Atlantic and evaporation. Over the past several years they have not been enough to offset the "inflows" and the water has risen. There are joint USA and Canada "management" boards but they don't seem to have much say in what Mother Nature does
")
.
Just for something to do I did a little calculation on what it would take to lower the Great Lakes by 1 metre.
I assumed it was a single surface area of 244,106 sq km with no inflow and the single outflow is the maximum that has ever been released at the Moses.Saunders 10,700 cubic/m per second. I calculate 266 days - that’s a lot of water!
EDIT: Just to put that in terms I can sort of wrap my head around - an olympic sized pool is 50 x 25 x 2 or 2500 cubic meters of water.
The volume above would be approx 98 MILLION “pools” of water!
Last edited:
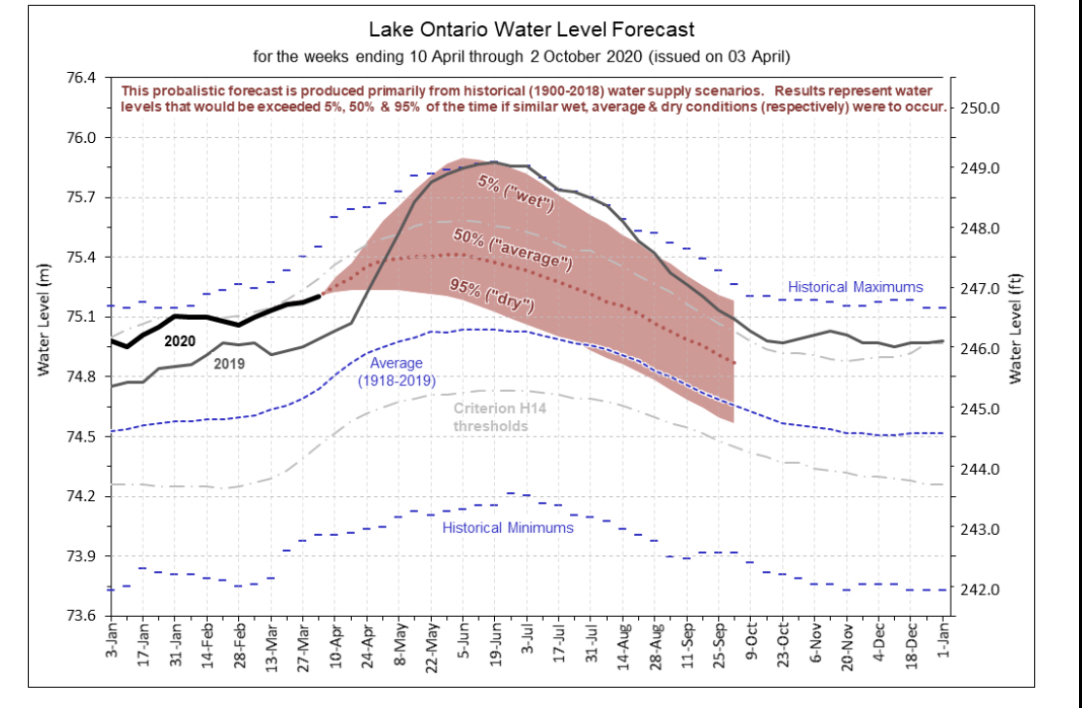
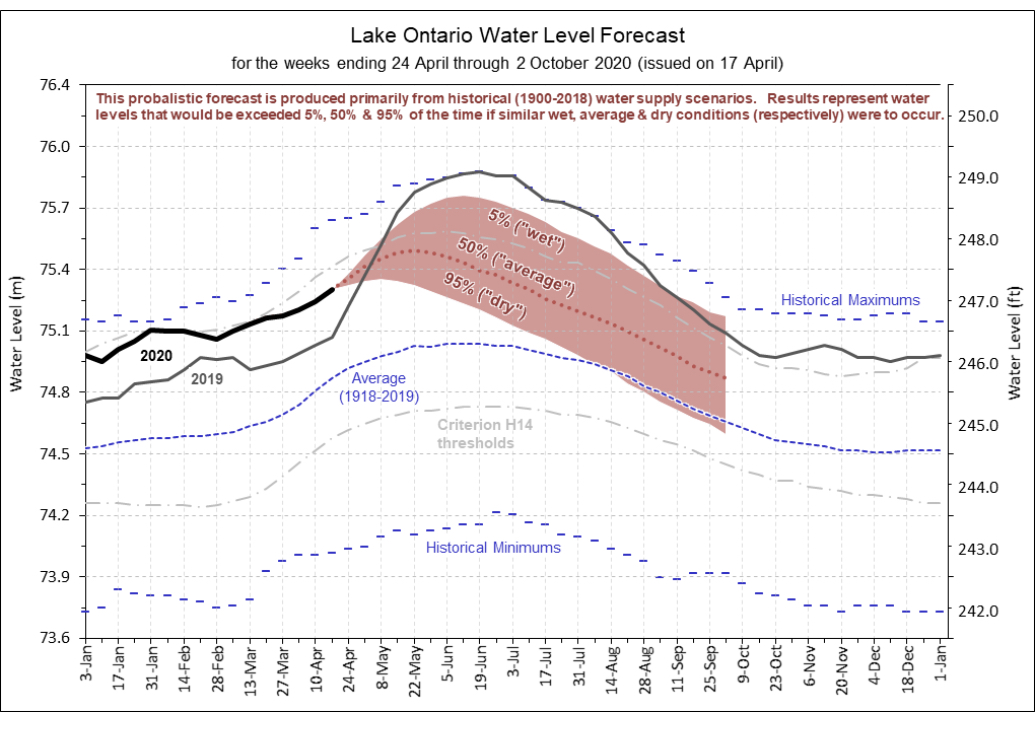
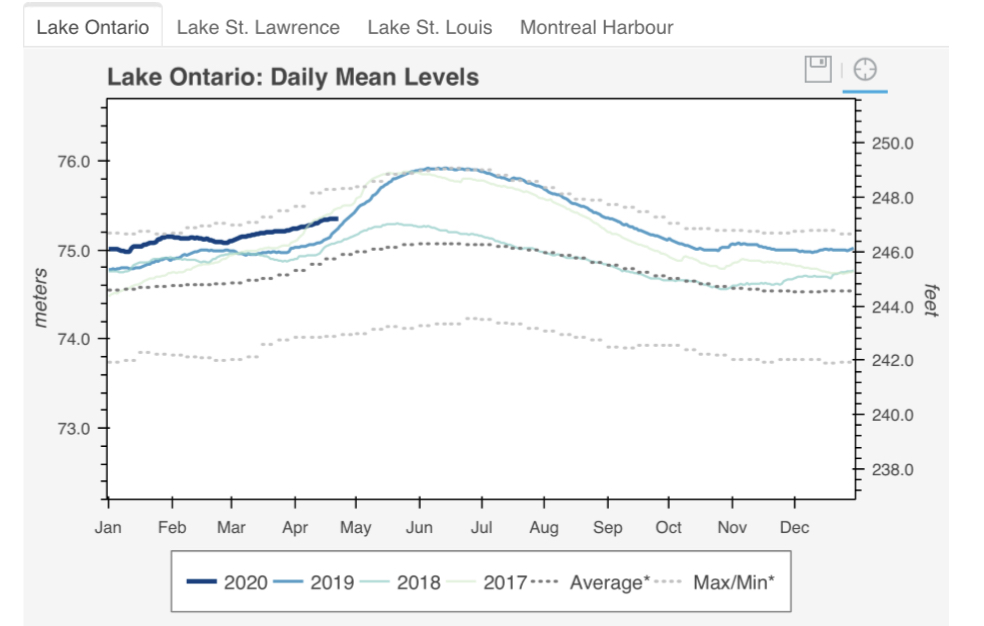
Projection from week ending April 10 compared to April 24! Hopefully things continue to improve
Attachments
-
 367.7 KB Views: 233
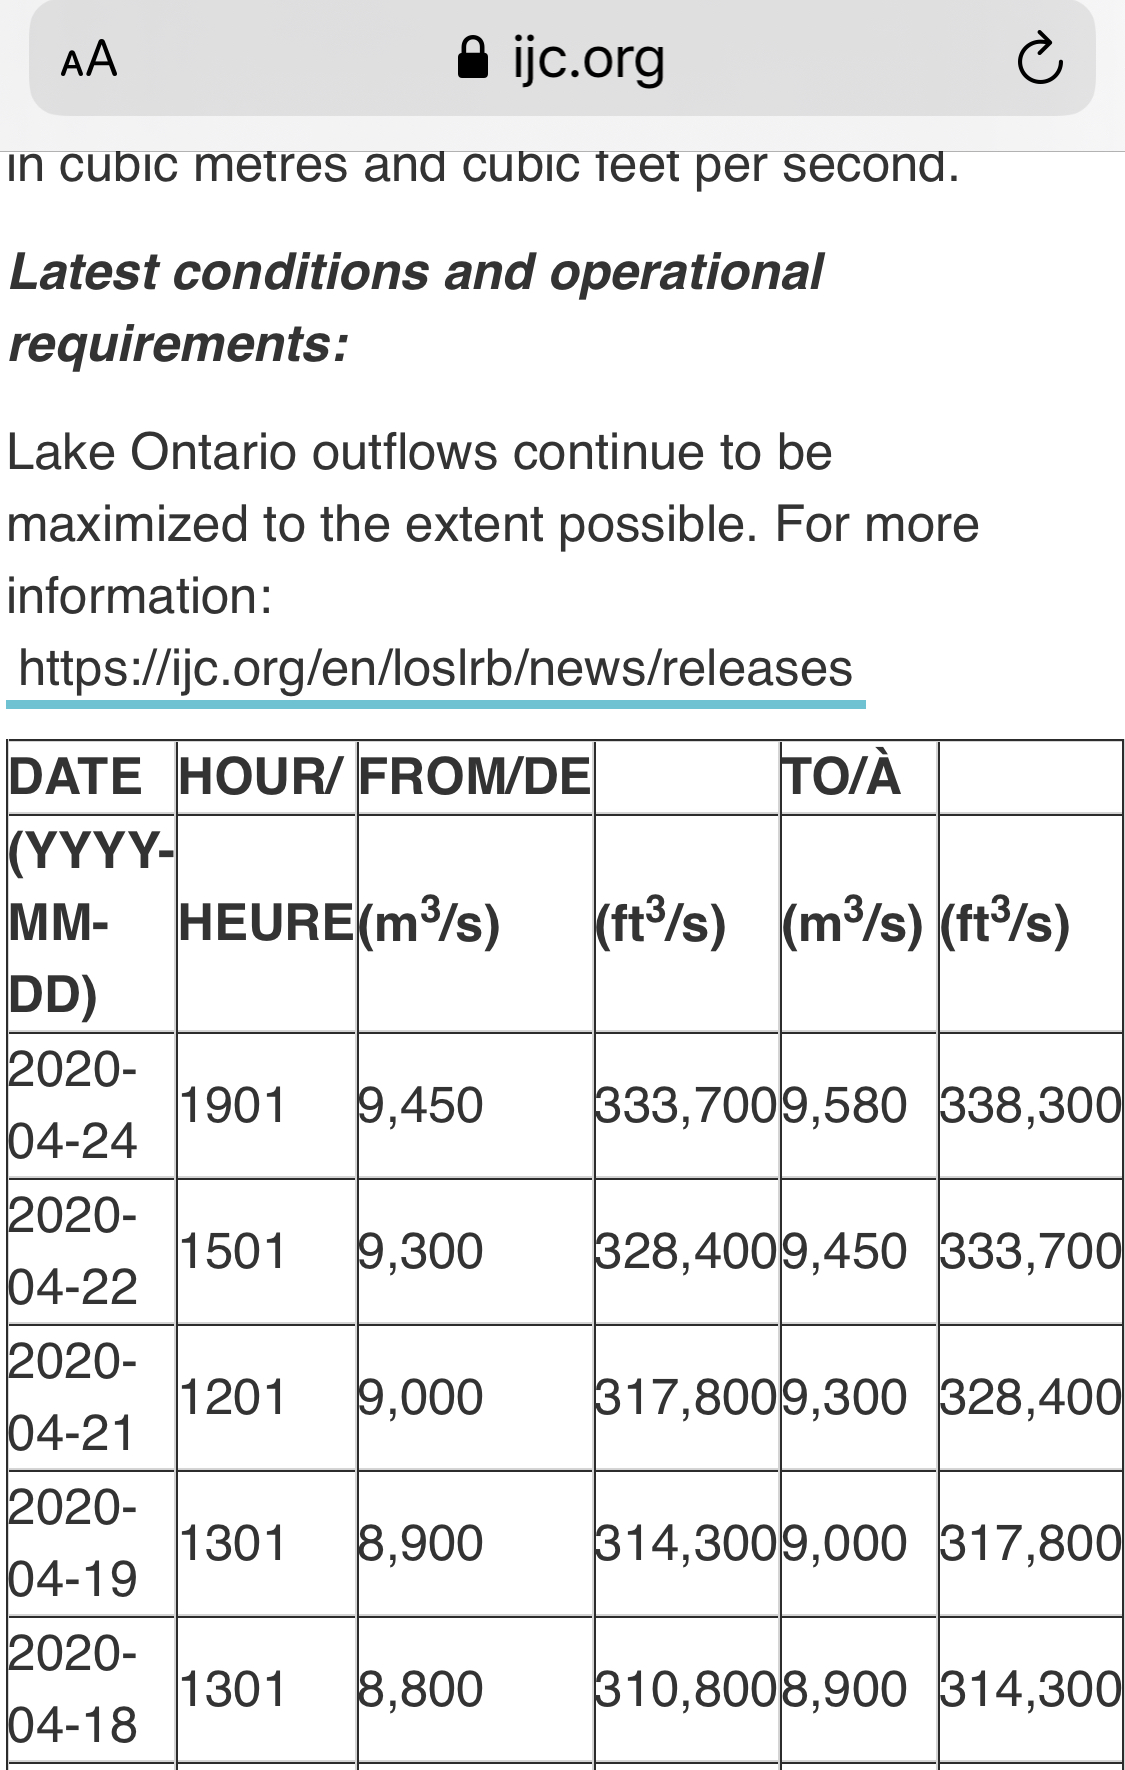
Latest news from IJC. Some hope for better conditions than 2017 and 2019!
 ijc.org
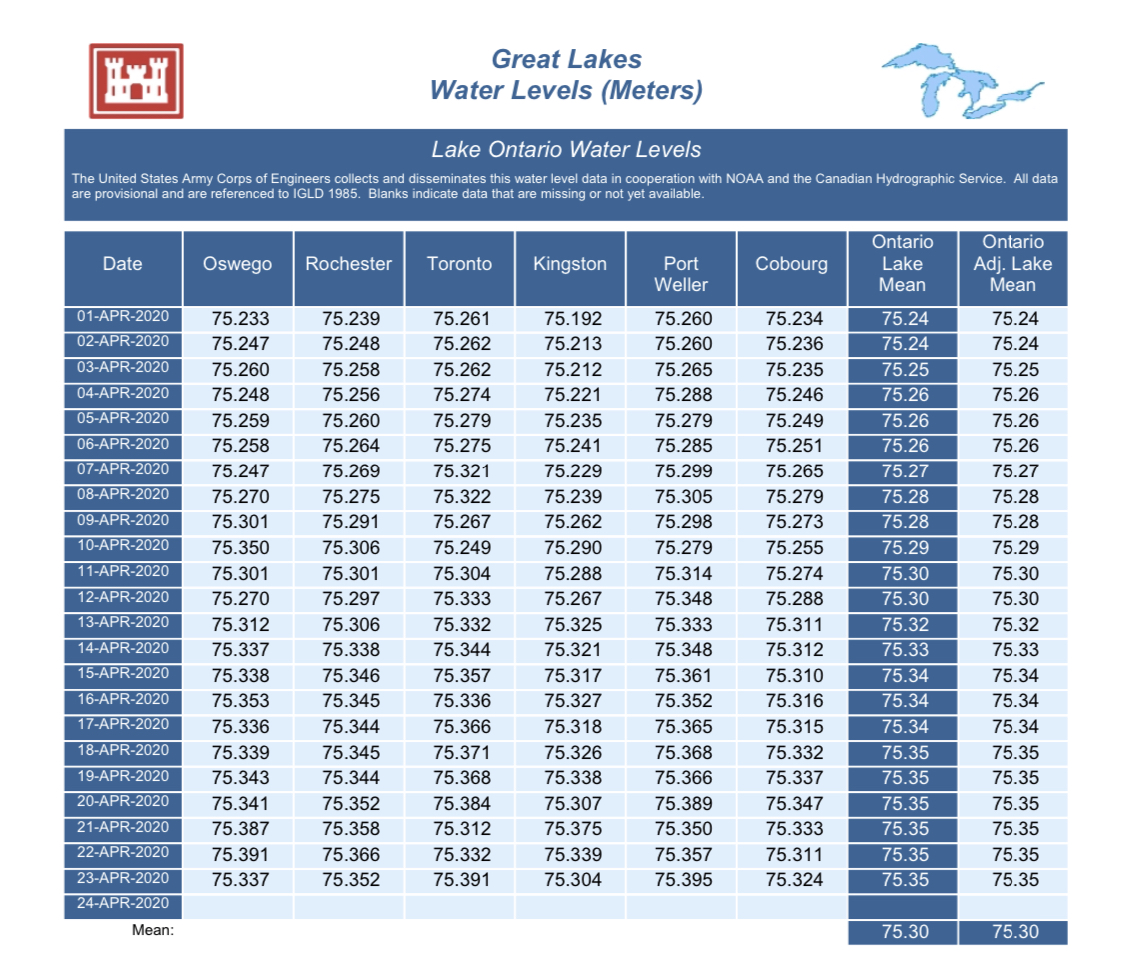
I don’t if this was posted before but thought I would place it here. The frequency of current levels data on the IJC site has gone down, I’m assuming the impact is Covid - staff related. I’m sure they are doing what they can. This site provides daily level info
Lake Ontario - St. Lawrence River System: Comparison, Update and Outlook | International Joint Commission
Water levels remain high across the Great Lakes basin. The four upper Great Lakes are near- or above record-high levels, while Lake Ontario is still well above average, but also well below record levels. Lake Ontario is now likely to remain below record-highs through the spring.
I don’t if this was posted before but thought I would place it here. The frequency of current levels data on the IJC site has gone down, I’m assuming the impact is Covid - staff related. I’m sure they are doing what they can. This site provides daily level info
I went down to our marina on the north shore of Lake Ontario and the water was more than a foot lower than the peak last spring. I had assumed by what I had read here that the peak would be even higher than last year but it certainly doesn't look like it at this time anyway.
@danstanford
2020 water levels in January were higher than either 2017 or 2019 so the forecast wasn’t looking good. Fortunately we have had some weather since then (mild winter, early spring runoff on Ottawa River) that have helped “flatten the curve”
I am optimistic that we may already be at the peak and conditions are allowing for an early increase of outflow at the dam which should bring the level down if it can outpace inflow.
It looks like the historical trend is for the peak to be anywhere between the end of May and the beginning of July. My experience with weather tells me that low rainfall at one time often means higher rainfall later. I'm not trying to be negative, just cautionary.I am optimistic that we may already be at the peak and conditions are allowing for an early increase of outflow at the dam
-Will (Dragonfly)
You are correct in saying the normal peak time has not arrived however a big contributor to the peak is related to what happens on the Ottawa River. When it’s flow is high - every spring they dial down outflow at the dam or they risk flooding Montreal etc.It looks like the historical trend is for the peak to be anywhere between the end of May and the beginning of July. My experience with weather tells me that low rainfall at one time often means higher rainfall later. I'm not trying to be negative, just cautionary.
-Will (Dragonfly)
This spring they had an early gradual freshet so that peak has already happened and they are increasing outflow at the dam again.
IF and that’s always the issue we don’t get significant rainfall the level is then driven by inflow from Lake Erie and outflow at the dam.
I’m optimistic because the “Lake Ontario trend” this year has been quite a bit different than 2017 and 2019 and more like 2018. A guy can hope
Last edited:
The current projections look good. Water levels will be above average, but not at flood levels.
It will be a good year for bigger boats going to School House Bay on Main Duck Island, one of my favorite spots.
Oh wait, the border is closed.
It will be a good year for bigger boats going to School House Bay on Main Duck Island, one of my favorite spots.
Oh wait, the border is closed.
I guess that depends on how much anchor rode you carryOh wait, the border is closed.
There was a time when we just didn't bother with such nonsense as checking in with Customs. Who was going to bother us out in the middle of Lake Ontario. Not any more.
@jon hanseni predict that next july the water level of lake michigan/lake huron will be 18 inches higher than it was this last july setting a new all time record for modern times.
I was just looking at the current GL water level projections and was wondering if you remain confident in your initial prediction.
yes I’m bored and trying to stir the pot!If I read the graph correctly the level last July was 582 ft ( chart datum 577.5 + 4.5 above)
Your prediction for July 2020 is 1.5 ft higher than last year or 583.5 ft
Looking at the chart prediction gives a max of 582’-10” or 8” lower than your prediction.
Last edited:

Hunter 216, the highest mark last year on lake michigan was 579.82 ft. i predicted 1.5 ft more this year. that was not the all time recorded high for the lake. the lake has set new all time records every month so far this year. so, 579.82' + 1.5' = 581.32' that would be my prediction. not the math you claim, with your disclaimer noted. . so the chart you shared shows i'm am within it's possibilities. i do not want to win this claim, but it better stop raining so much around here. the lake is on track to set a new all time record high for as long as we have been keeping records. get your waders ready
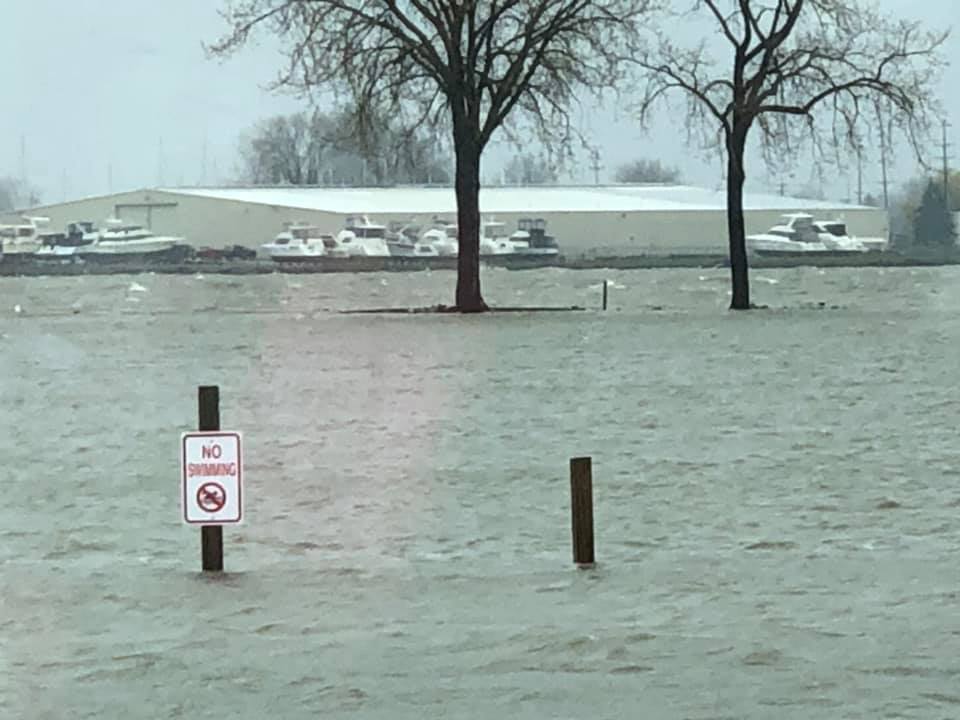
. so the chart you shared shows i'm am within it's possibilities. i do not want to win this claim, but it better stop raining so much around here. the lake is on track to set a new all time record high for as long as we have been keeping records. get your waders ready Tip for you guys on Lake Ontario. Buy futures in companies that make hip waders. Lake Erie is currently at 71" above chart datum, a historical high. Predicted 11" higher than last years historic highs. Pic is from yesterday. Our basin is awash with Sandusky Bay breaching the pier. Never seen whitecaps in the parking lot. Fortunately we have floating docks. We also have put 1-1/2 foot wall around the marina with film and sandbags behind it. That didn't work too well yesterday when the pier was washed over. I imagine there will be some new lakefront property on Lake Ontario soon.
JonHunter 216, the highest mark last year on lake michigan was 579.82 ft. i predicted 1.5 ft more this year. that was not the all time recorded high for the lake. the lake has set new all time records every month so far this year. so, 579.82' + 1.5' = 581.32' that would be my prediction. not the math you claim, with your disclaimer noted.
I think I see why my numbers are different than yours. The level I used for last July was from the chart I linked. I post an image below for reference. I could very well not be reading the chart - graph correctly
but here is how I get a value of 582 ft for last July.Chart Datum of 577.5 ft is O on the left side of the graph. If I count the ticks on the left side each one equals 2 inches so the Red line at July 2019 is 4.5 ft more than 0 so 577.5 + 4.5 = 582.
Your start value is 2.18 ft OR 26.16 inches less than mine.
If I look at the "prediction" for July 2020 in the graph the max point is + 5' 4" above datum or 10 inches more than 2019.
Maybe the graph is wrong?? Your local so certainly know what the water level is.
I agree with your hope on it raining less as all of the GL are too high. Lake Ontario is better off at the moment compared to last year but all the water upstream is going to come this way eventually!!