What astounds me is that comparing today's chart of my area to one from way back the yearly change in variation seems to have reversed directionThere was also usually a statement to the effect "variation changes +x degrees per year", such that you also had to check the date the chart was printed and add or subtract additional variation to your calculations
The North Pole is moving!
- Thread starter dlochner
- Start date
Lol, this is along the same lines of sunrise and sun set times... welcome to the 10th centuryActually, magnetic North never moves. The Earth shifts around it. For that matter, so does the whole solar system and galaxy as well. Pretty amazing really.
-Will ("satyrist", Dragonfly)
")
Unless you’re viewing the Southern Cross for the first time.You can always calculate your own variation, each night the North Star is visible.
-Will (Dragonfly)
jssailem
SBO Weather and Forecasting Forum Jim & John
- Oct 22, 2014
- 24,516
If your viewing the Southern Cross and trying to find the North Pole, I think you have a condition known to professionals as
“Equatorially Challenged”.
“Equatorially Challenged”.
That is me!!“Equatorially Challenged”
I had to increase my BELT size a few years ago.
Jim...
PS: Elastic waistlines work good.
jssailem
SBO Weather and Forecasting Forum Jim & John
- Oct 22, 2014
- 24,516
I think it's a syndrome known as ECS.I think you have a condition known to professionals as
“Equatorially Challenged”.
There is no cure, only control.
Symptoms include (but not limited to): bringing out the Champaign at inappropriate times while sailing anywhere between the equator and one of the poles, pointing out constellations in the sky you have no idea what their names are, and not knowing which direction your toilet bowl swirls in. Oh yeah, and needing a bigger belt.
-Will (Dragonfly)
hmmm?which direction your toilet bowl swirls
1) Which way does it swirl at the Equator?
2) Can you observe, at night, the Southern Cross and North star at the Equator?
3) Does your compass still point North in the southern hemisphere?
4) Does Cassiopeia and Ursa Major appear in the Southern Hemisphere?
Jim...
PS: Don't be a Big Dipper
I was very surprised, on my first long sail, to have been able to see the north star and the southern cross at the same time when we were about 3/4 way across the Gulf of Mexico, heading to Isla Mujeres , Mx .. I didn't think I'd be able to see the cross until much further south..
Actually it normally seen below the Tropic of Cancer [Lat 20° N], but harder to plot the South pole since it is low on the Southern horizon. Sometimes on a clear night and in the Winter, Lat 35° N.I didn't think I'd be able to see the cross until much further south..
But...
You can get General Direction of South, when Polaris is obscured.
Jim...
PS: Don't be a Little Dipper either!
Since you just pointed out Polaris, does that make you a big dipper?Don't be a Little Dipper either!
-Will (Dragonfly)
NotCook
.
- Dec 29, 2008
- 806
I can at least attest to being able to see both from about 17.5 degrees (St. Croix).2) Can you observe, at night, the Southern Cross and North star at the Equator?
Here was the view of the Southern Cross
I was recently looking through all the stargazing apps on my phone ... There were so many of them, I couldn't choose one. Guess I have a starting place now. Thanks!using SkyView a couple of weeks ago ...
We're waiting for the frantic phone call from @jssailem and @LeslieTroyer as they cross the boundary and see the end of the world in a couple of weeks.
jssailem
SBO Weather and Forecasting Forum Jim & John
- Oct 22, 2014
- 24,516
The world is flat.
Then there is Canada.
May this not be our last adventure.
Then there is Canada.
May this not be our last adventure.
What I noticed was no one was smiling in that video.The world is flat. Then there is Canada.
Must be a loss of the cellular service "at end of the world".We're waiting for the frantic phone call
Make sure you have plenty of anchor rode, so you can drop it just before going off the edge.
Jim...
PS: Does an anchor drop faster at the Equator or near a pole?
PS: Does an anchor drop faster at the Equator or near a pole?
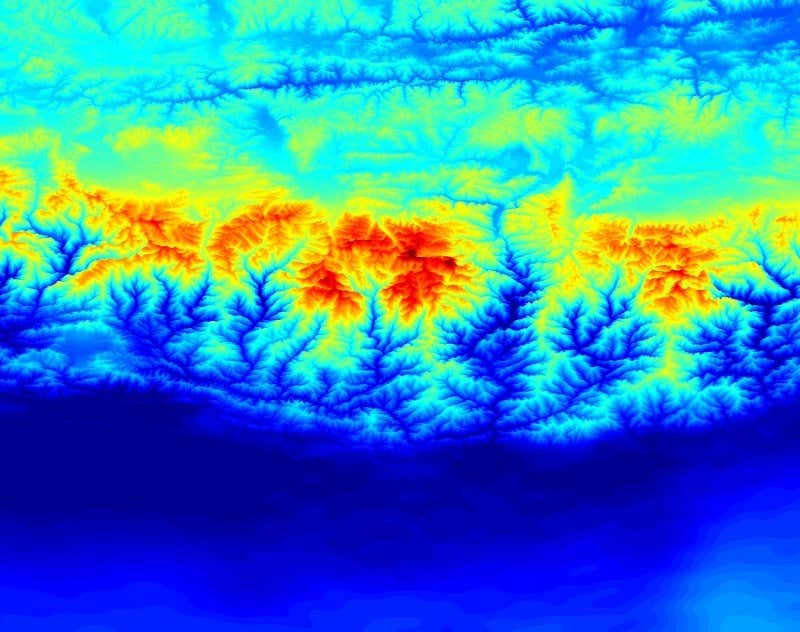
Gravity map.
"Gravity is often assumed to be the same everywhere on Earth, but it varies because the planet is not perfectly spherical or uniformly dense. In addition, gravity is weaker at the equator due to centrifugal forces produced by the planet’s rotation. It’s also weaker at higher altitudes, further from Earth’s centre, such as at the summit of Mount Everest."
From: https://www.newscientist.com/article/dn24068-gravity-map-reveals-earths-extremes/
"Mount Nevado Huascarán in Peru has the lowest gravitational acceleration, at 9.7639 m/s2, while the highest is at the surface of the Arctic Ocean, at 9.8337 m/s2"
"These differences mean that in the unlikely event that you found yourself falling from a height of 100 metres at each point, you would hit the surface in Peru about 16 milliseconds later than in the Arctic. "
-Will (Dragonfly)
Passage. They could have named it Boundary Fall Off the End of the Earth Passage, but that probably took too much calligraphy space on the chart.There is the concern about the Boundry Passage. Is it a cliff? Or a wall?
Edit; I just walked over to get the mail, and the North Pole is unmoved this morning, and it wasn't brushed off either, so today it's a navigation hazard.