CAUTION: LOOKING AT THE SUN CAN BLIND YOU IF YOUR EYES ARE NOT PROTECTED.
The news from the STCE is about the largest sunspot cluster so far observed during this solar cycle. Here is the image viewed through the solar telescope. The region has been labeled NOAA 13590.
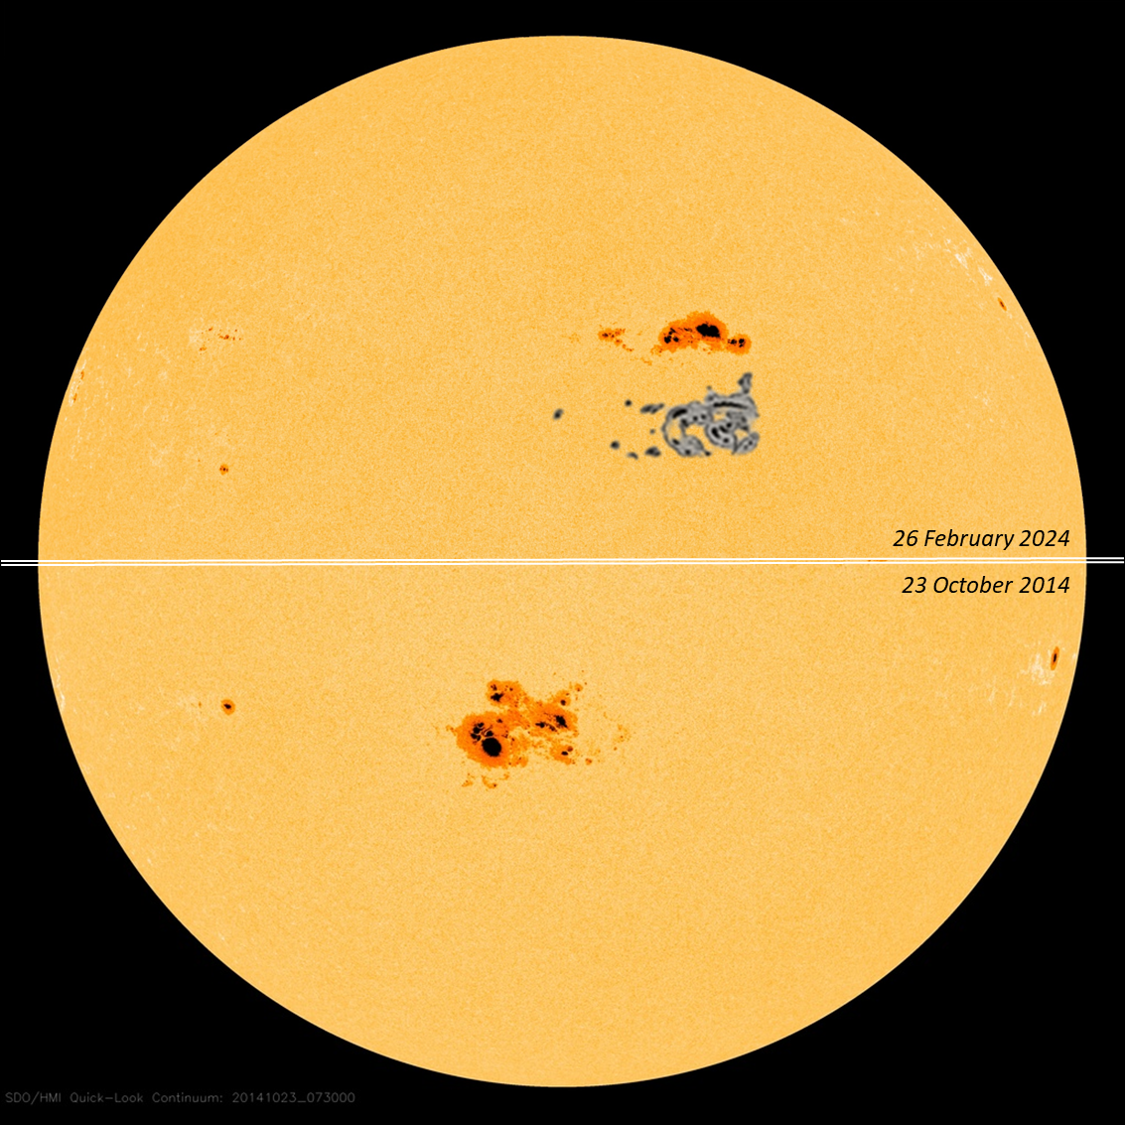
Active region NOAA 13590 has been the talk of the town this week. This region has a sunspot area of about 9 times the total surface area of the Earth and was -using eclipse glasses- an easy naked eye object. To put things in perspective, the compilation underneath was created using SDO/HMI white light images (SDO | Solar Dynamics Observatory ). The top half of the figure shows a 26 February image of NOAA 13590 with a nearby overlay of the Carrington sunspot group from 1859 for comparison (same scale - Taken from Toriumi and Wang 2019 - https://link.springer.com/article/10.1007/s41116-019-0019-7 ; Hayakawa et al. 2018 - Radware Bot Manager Captcha ). Clearly, NOAA 13590 is still quite smaller than the Carrington sunspot group. The Carrington group itself was not the largest group ever observed, and is actually a bit smaller than NOAA 12192, the largest region from the previous solar cycle (SC24), as shown in the lower half of the figure. Though both sunspot groups were very large, there have been several sunspot regions larger than these two, with the sunspot group of April 1947 still the largest observed since systematic daily observations started in the mid-19th century (see the STCE newsitem at NOAA 2192 in perspective | STCE ). To put things in perspective, the reported or calculated USAF/NOAA sunspot areas for the mentioned active regions are 1450 MH (NOAA 13590), 2300 MH (Carrington group), 2610 MH (NOAA 10486), 2750 MH (NOAA 12192), and a whopping 4380 MH (April 1947 group). "MH" means "millionths of a solar hemisphere" (see SWx acronyms | STCE ), and for the corresponding Greenwich values, the USAF/NOAA areas have to be multiplied by 1.4.
The chart underneath shows the accumulated averaged number of big, super and giant sunspot groups that appear for each year of a standard 11-years solar cycle with a maximum smoothed sunspot number of 175.8 (vertical bars; the average of solar cycles 12 to 24).

The graph underneath shows since 1975 the smoothed sunspot number with an indication for the months with X-class flares. Notorious absent during this and previous solar cycle are the red dots, i.e. months with 10 X-class flares or more. The last month with 10+ X-class flares dates back from September 2005, that's almost 20 years ago! Space weather forecasters on duty that month are still traumatized by the wrath of active region NOAA 10808..

The news from the STCE is about the largest sunspot cluster so far observed during this solar cycle. Here is the image viewed through the solar telescope. The region has been labeled NOAA 13590.
Active region NOAA 13590 has been the talk of the town this week. This region has a sunspot area of about 9 times the total surface area of the Earth and was -using eclipse glasses- an easy naked eye object. To put things in perspective, the compilation underneath was created using SDO/HMI white light images (SDO | Solar Dynamics Observatory ). The top half of the figure shows a 26 February image of NOAA 13590 with a nearby overlay of the Carrington sunspot group from 1859 for comparison (same scale - Taken from Toriumi and Wang 2019 - https://link.springer.com/article/10.1007/s41116-019-0019-7 ; Hayakawa et al. 2018 - Radware Bot Manager Captcha ). Clearly, NOAA 13590 is still quite smaller than the Carrington sunspot group. The Carrington group itself was not the largest group ever observed, and is actually a bit smaller than NOAA 12192, the largest region from the previous solar cycle (SC24), as shown in the lower half of the figure. Though both sunspot groups were very large, there have been several sunspot regions larger than these two, with the sunspot group of April 1947 still the largest observed since systematic daily observations started in the mid-19th century (see the STCE newsitem at NOAA 2192 in perspective | STCE ). To put things in perspective, the reported or calculated USAF/NOAA sunspot areas for the mentioned active regions are 1450 MH (NOAA 13590), 2300 MH (Carrington group), 2610 MH (NOAA 10486), 2750 MH (NOAA 12192), and a whopping 4380 MH (April 1947 group). "MH" means "millionths of a solar hemisphere" (see SWx acronyms | STCE ), and for the corresponding Greenwich values, the USAF/NOAA areas have to be multiplied by 1.4.
The chart underneath shows the accumulated averaged number of big, super and giant sunspot groups that appear for each year of a standard 11-years solar cycle with a maximum smoothed sunspot number of 175.8 (vertical bars; the average of solar cycles 12 to 24).
The graph underneath shows since 1975 the smoothed sunspot number with an indication for the months with X-class flares. Notorious absent during this and previous solar cycle are the red dots, i.e. months with 10 X-class flares or more. The last month with 10+ X-class flares dates back from September 2005, that's almost 20 years ago! Space weather forecasters on duty that month are still traumatized by the wrath of active region NOAA 10808..
