If you google "ice age in the 70's" or something like that, lots of links come up. I think that "scare" was out of concern that air pollution would block the sun energy and I guess if air pollution is bad enough, might be a valid concern. I think regulations after that did clean up the air.
The Next Thing.....
- Thread starter nat55
- Start date
Difficult question. Doing something is going to be painful. One country going full steam ahead will become stronger, another country trying to cut back would become weaker. China does produce a lot more CO2 than the US but of course guess who is consuming those goods that are creating the CO2.However what's the point of the United States shackling our economy to put out less when we do not put out as much India or China?
Hasn't the current warming trend been going on for some 20,000-ish years?I dont have much doubt that we have caused the current warming.
This is Greenland ice core readings for about the last 12 thousand years. On the left, you can see the temperature rising and coming out of the previous glacier period. Looks to me like we had already peaked and were actually slowly cooling again right up until about 200 years ago (spike on the right side of the graph). You can look at the Milankovitch solar driver for our current inter glacier period called the Holocene here http://clivebest.com/blog/?p=8656 and it looks to me that if that graph is correct, its already peaked and now very slowly falling, We will eventually go into another ice age "sometime".. but hopefully not for another 5000 years??? Reference where this plot came from is in post 19. One thing about the warming.. its likely way better than beginning another glacier period.

Last edited:
Oh we are now offering an opinion?Looks to me
Note: Who averaged the temperatures from 1880-1960? Where is that data referenced?
Jim...
PS: That is what got Gore in trouble, ice core data misread.
I will try and look that up.. but what plot are you talking about and what is important about those dates???Oh we are now offering an opinion?
Note: Who averaged the temperatures from 1880-1960? Where is that data referenced?
Jim...
Hmm.. maybe now I know. The reference says this data is from Berkeley Earth but the exact years are not given. Is this important? (I gave a link, you should also)
http://berkeleyearth.org/data/
Last edited:
A photographer friend of mine was asked aboard a private sailboat that went through the Northwest passage in the summer of 2016. He says it was a trip of a lifetime. He documented the trip. His photos are breathtaking.
What stuck with me hearing about the trip was the damage the receding ice was doing to the Innuit people living along the way. These ancient indigenous people have subsisted hunting the large mammals that flourish on the ice.
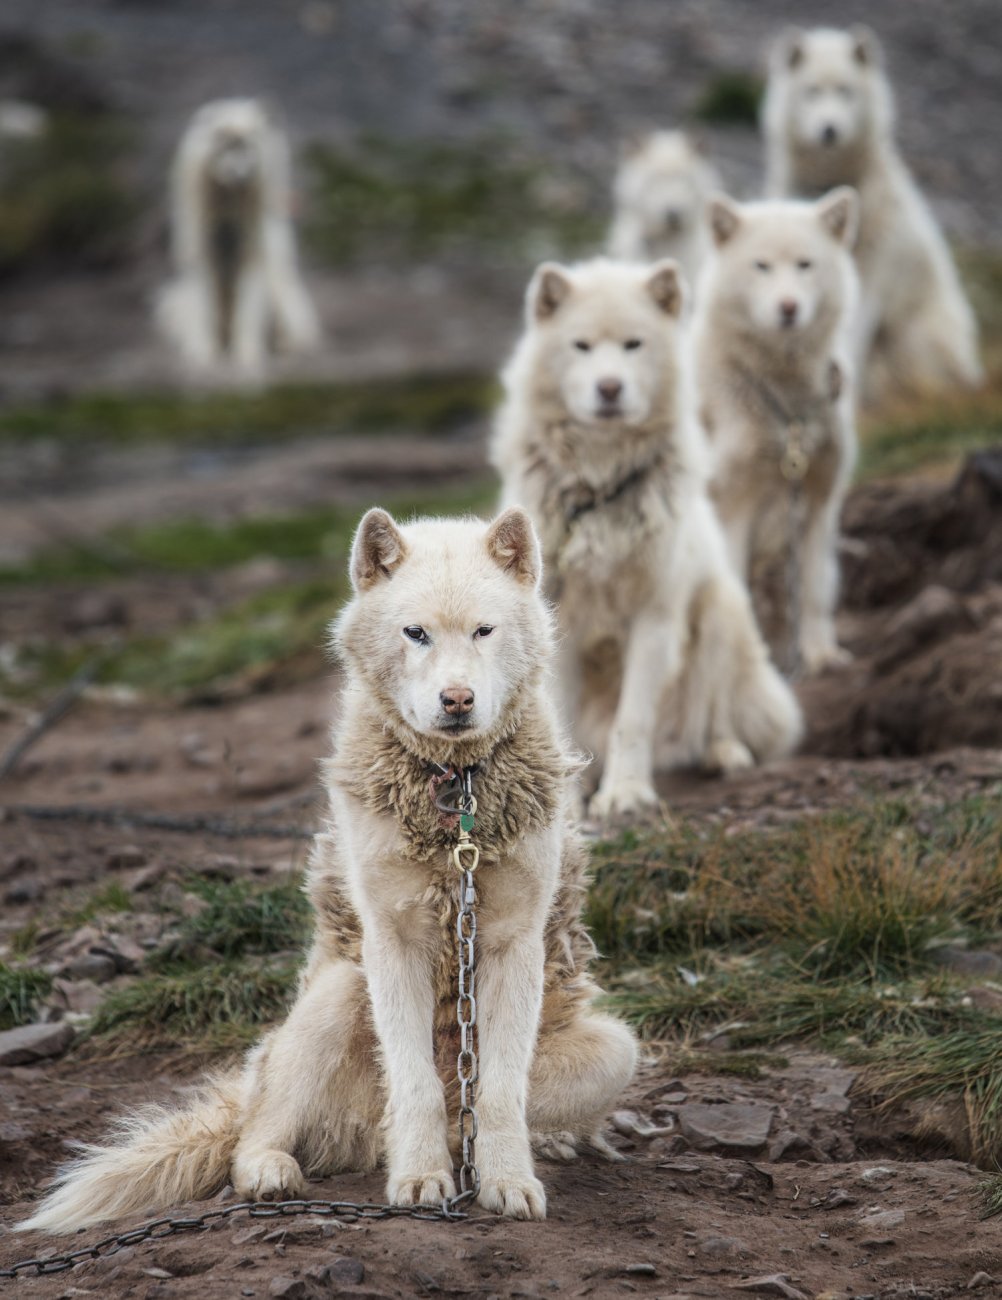
Their prey has followed the rapidly receding ice, Northward, out of their home grounds. Many of these people still depend on working sled dogs to pull loads. Those dogs depend on that meat as well, to survive.
My friend said the high cost of dog food was out of the question for some of these people. "They are shooting their dogs", is the phrase that stuck with me.
One of his photos:
What stuck with me hearing about the trip was the damage the receding ice was doing to the Innuit people living along the way. These ancient indigenous people have subsisted hunting the large mammals that flourish on the ice.
Their prey has followed the rapidly receding ice, Northward, out of their home grounds. Many of these people still depend on working sled dogs to pull loads. Those dogs depend on that meat as well, to survive.
My friend said the high cost of dog food was out of the question for some of these people. "They are shooting their dogs", is the phrase that stuck with me.
One of his photos:
Walt, I'm perfectly okay with your "looks to me", and with your blessing I will use one of my own. You present your side of the subject with as much class and eloquence as anyone I have heard.
But wouldn't you agree that 12,000 years is the blink of an eye, in geologic terms?
Using Vostok data, and taking it back much further, a different story is told - or so it looks to me.") Temps have been very wonky for the last 12,000 years, leaving me very skeptical of any climatologist (or politician) who claims to know for certain where they are going from here.
Temps have been very wonky for the last 12,000 years, leaving me very skeptical of any climatologist (or politician) who claims to know for certain where they are going from here.
With the utmost respect to @TomY , I do not believe pictures of dogs (however cute they may be!) and third-hand reports of them being shot, really belong in the dialogue. Most of us already believe that the climate (weather?) has gotten slightly warmer over the past century. The cause and significance of that slight increase, over a nanosecond of geologic time, is where people begin to differ.
I myself do not have an opinion, or even a guess. Only a healthy skepticism of those who claim to be absolutely certain. And perhaps even a degree of worry, when loud, angry voices shout down differing opinions, attack those who hold them, and work to silence any debate on the subject. (Not talking about you here, Tom!)

But wouldn't you agree that 12,000 years is the blink of an eye, in geologic terms?
Using Vostok data, and taking it back much further, a different story is told - or so it looks to me.
Temps have been very wonky for the last 12,000 years, leaving me very skeptical of any climatologist (or politician) who claims to know for certain where they are going from here.With the utmost respect to @TomY , I do not believe pictures of dogs (however cute they may be!) and third-hand reports of them being shot, really belong in the dialogue. Most of us already believe that the climate (weather?) has gotten slightly warmer over the past century. The cause and significance of that slight increase, over a nanosecond of geologic time, is where people begin to differ.
I myself do not have an opinion, or even a guess. Only a healthy skepticism of those who claim to be absolutely certain. And perhaps even a degree of worry, when loud, angry voices shout down differing opinions, attack those who hold them, and work to silence any debate on the subject. (Not talking about you here, Tom!)
Last edited:
Earlier in this thread, there was some discussion on solar output causing the warming we are seeing. Note that solar output has been decreasing recently while global temps are going up.
You can find all sorts of information that confirm that the warming we have seen in the last two hundred years is caused by humans. Solar variations do affect global temperatures and local anomalies. But the affect of solar is significantly lower than the affect of all the things humans are doing. A bunch of links below..
https://www.ucsusa.org/global-warmi...ffect-of-sun-on-climate-faq.html#.W3G2_uhKjIU

https://skepticalscience.com/solar-activity-sunspots-global-warming.htm

Also interesting on the subject of solar changes affecting the climate is the possibility of a Grand Solar minimum in the near future which would DROP solar output. The links below discuss this.
https://science.nasa.gov/science-news/science-at-nasa/2013/08jan_sunclimate
https://agupubs.onlinelibrary.wiley.com/doi/full/10.1029/2011JD017013
You can find all sorts of information that confirm that the warming we have seen in the last two hundred years is caused by humans. Solar variations do affect global temperatures and local anomalies. But the affect of solar is significantly lower than the affect of all the things humans are doing. A bunch of links below..
https://www.ucsusa.org/global-warmi...ffect-of-sun-on-climate-faq.html#.W3G2_uhKjIU
We do know with a good degree of certainty that between 1750-2011, or since the beginning of the industrial period until today, the average increase in energy hitting a given area of the atmosphere (radiative forcing, measured in a unit called watts per square meter) due to heat-trapping gases is 56 times greater (~ 2.83 watts per square meter) than the increase in radiative forcing from the small shift in the sun’s energy (~0.05 watts per square meter).
https://skepticalscience.com/solar-activity-sunspots-global-warming.htm
Also interesting on the subject of solar changes affecting the climate is the possibility of a Grand Solar minimum in the near future which would DROP solar output. The links below discuss this.
https://science.nasa.gov/science-news/science-at-nasa/2013/08jan_sunclimate
https://skepticalscience.com/print.php?r=448Indeed, the sun could be on the threshold of a mini-Maunder event right now. Ongoing Solar Cycle 24 is the weakest in more than 50 years. Moreover, there is (controversial) evidence of a long-term weakening trend in the magnetic field strength of sunspots. Matt Penn and William Livingston of the National Solar Observatory predict that by the time Solar Cycle 25 arrives, magnetic fields on the sun will be so weak that few if any sunspots will be formed. Independent lines of research involving helioseismology and surface polar fields tend to support their conclusion. (Note: Penn and Livingston were not participants at the NRC workshop.)
https://agupubs.onlinelibrary.wiley.com/doi/full/10.1029/2011JD017013
. By using past solar activity measures calibrated to reconstructions of TSI we are able to estimate the future changes of the Sun, assuming that it will leave the current level of activity in the next 10–20 years. Even in the event of the Sun entering a new Maunder Minimum like activity state the climate response is very small compared to the projected warming due to anthropogenic influences (the probability of this within the next 40 years has been estimated to be 8% by Lockwood [2010]. The projected warming of the HadCM3 model for the B2 SRES scenario is 2.55 K by the end of the 21st century with respect to the end of the 20th century and using the most recent TSI reconstructions, a Maunder Minimum like future change gives relative reductions of less than 0.13 K. There is a possibility that by the end of the 21st century solar activity returns to current levels, but as we assume there is a reduction of solar activity in the near future to “normal” levels there may still be a drop in temperature relative to the projected end of century warming. A sensitivity analysis assuming that the solar cycle response is larger than climate models simulate still produces small variations over what is projected because of anthropogenic forcings only. Only when an older TSI reconstruction is used and the response of climate models to solar influence amplified are more substantial variations found that could mitigate what is still a relatively small fraction of the projected anthropogenic warming, a scenario which we cannot rule out but given the latest assessment of TSI variations and understanding of the climate system we feel is unlikely.
"With the utmost respect to @TomY , I do not believe pictures of dogs (however cute they may be!) and third-hand reports of them being shot, really belong in the dialogue."
I thought this thread was about the Northwest Passage, Gene.
I haven't been following the 'discussion' that I surmise is denying climate science.
On climate change, I follow the climate scientist on planet Earth, the vast majority of which believe the planet is warming, that warming has increased in the last several decades and that acceleration is largely due to our fossil fuel use here on the planet.
Nat's starting post was about a guy who will paddle board through the Northwest Passage in the hopes of bringing attention to the plight caused by the receding ice. I wish him luck.
Last edited:
We all tend to use graphs and correlations as a method to prove a trend or evidence of a hypothesis.
All of the Green House Gas [GHG] issue is just that.
hypothesis | hīˈpäTHəsəs | noun (plural hypotheses | -ˌsēz | ) a supposition or proposed explanation made on the basis of limited evidence as a starting point for further investigation
This is a what a trend or correlation, our minds do when looking at a graph. We tend to simplify.
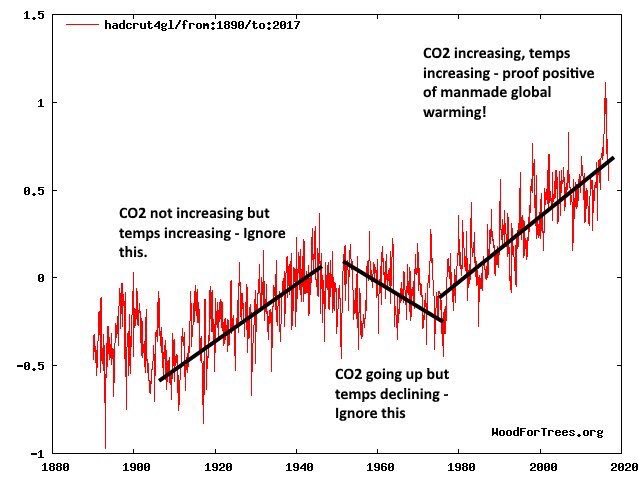
Reference noted on graph. So what does this prove to the Hypothesis of GHG?
Please note our "eyes" focus on the black lines. Are the Black lines scientifically placed?
Also the notes guide us to make a "point" about GHG , which was limited to just CO2.
I will show the same graph on a new post after this sinks in a bit.
Jim..
All of the Green House Gas [GHG] issue is just that.
hypothesis | hīˈpäTHəsəs | noun (plural hypotheses | -ˌsēz | ) a supposition or proposed explanation made on the basis of limited evidence as a starting point for further investigation
This is a what a trend or correlation, our minds do when looking at a graph. We tend to simplify.
Reference noted on graph. So what does this prove to the Hypothesis of GHG?
Please note our "eyes" focus on the black lines. Are the Black lines scientifically placed?
Also the notes guide us to make a "point" about GHG , which was limited to just CO2.
I will show the same graph on a new post after this sinks in a bit.
Jim..
humans will multiply and use up all the resourses needed to keep them going and then die out. just like yeast in sugar water. this is how nature works. i think worrying about is a fruitless. just my opinion.
enjoy the day
enjoy the day
Here is the plot that Gene posted and fits in well with some of the discussion here. (you should have given the reference where the plot came from.. please)

This plot goes out over 400 thousand years and shows that the planet has been going through periods of glaciers where ice sheets might cover where most of us live now to warm periods called interglacier. We are currently living in the warm period shown over the right in the graph. Here is a link with a bunch of stuff to read on this periodic pattern http://clivebest.com/blog/?page_id=6046 You will notice that there have been a bunch of the warmer time periods (high peaks in the blue) and they last for a while and then it turns back to a cold period. When the next cold period happens, it will result in a LOT of the current life dying off. These cold and warm periods have been correlated to periodic changes in our orbit around the sun called Milancovitch cycles (link and you can find many more http://clivebest.com/blog/?p=8656 There are three periodic influences and each has a different frequency so the phases dont line up for each warm period so they are all different. Here is a plot from the link showing the Milancovitch cycles and the glacier and interglacier pictures from Genes post

So. on this large time scale, we definitely go from warm periods to cold periods and it will happen again.
The point made earlier with the plot I showed for the ice core temps for the last 12000 years is that the warm periods do end and when they end, it gets colder. And there has been a slow trend towards getting colder. And.. the Milankocitch cycle has peaked and is slowly going towards forcing the next glacier cold period.
There is an argument that I see all the time that the current temperature spike is just natural. But that argument has to completely ignore some basic physics that CO2 and other gasses are very likely to be causing this warming. It also has to ignore that we were likely in a cooling phase. And it also has to ignore that no one can find any other reason for the warming spike even with all the measurements we are making now.
I gave some references.. hopefully if someone thinks that the current temperature spike just randomly occurred, they can find a reference agreeing with them. Then we can argue with the reference.
This plot goes out over 400 thousand years and shows that the planet has been going through periods of glaciers where ice sheets might cover where most of us live now to warm periods called interglacier. We are currently living in the warm period shown over the right in the graph. Here is a link with a bunch of stuff to read on this periodic pattern http://clivebest.com/blog/?page_id=6046 You will notice that there have been a bunch of the warmer time periods (high peaks in the blue) and they last for a while and then it turns back to a cold period. When the next cold period happens, it will result in a LOT of the current life dying off. These cold and warm periods have been correlated to periodic changes in our orbit around the sun called Milancovitch cycles (link and you can find many more http://clivebest.com/blog/?p=8656 There are three periodic influences and each has a different frequency so the phases dont line up for each warm period so they are all different. Here is a plot from the link showing the Milancovitch cycles and the glacier and interglacier pictures from Genes post
So. on this large time scale, we definitely go from warm periods to cold periods and it will happen again.
The point made earlier with the plot I showed for the ice core temps for the last 12000 years is that the warm periods do end and when they end, it gets colder. And there has been a slow trend towards getting colder. And.. the Milankocitch cycle has peaked and is slowly going towards forcing the next glacier cold period.
There is an argument that I see all the time that the current temperature spike is just natural. But that argument has to completely ignore some basic physics that CO2 and other gasses are very likely to be causing this warming. It also has to ignore that we were likely in a cooling phase. And it also has to ignore that no one can find any other reason for the warming spike even with all the measurements we are making now.
I gave some references.. hopefully if someone thinks that the current temperature spike just randomly occurred, they can find a reference agreeing with them. Then we can argue with the reference.
Last edited:
As to Jon's point.humans will multiply and use up all the resourses needed to keep them going
Lose weight and save the planet.
Jim...
When you shows the graphs, please show where they came from. And if you come to a conclusion regarding the graph, please let us know if its your own. Much better an believable if you can find a reference that agrees with you.I will show the same graph on a new post after this sinks in a bit.
FYI, regarding sinking in.. there are multiple things that affect the climate measurement. Enso variations, Pacific nodal oscillation, some Atlantic oscillation, sunspots. Some of those variations involve energy moving between the atmosphere and the ocean. Please post the source of your new graph but of course you get variations in global temperature that deviate from CO2 concentrations.
Ok this is not political but caused me the chuckle on how correlations can be used for what ever you want to prove.
BTW the correlation lines shown on the graph are true, but used prove NOTHING.
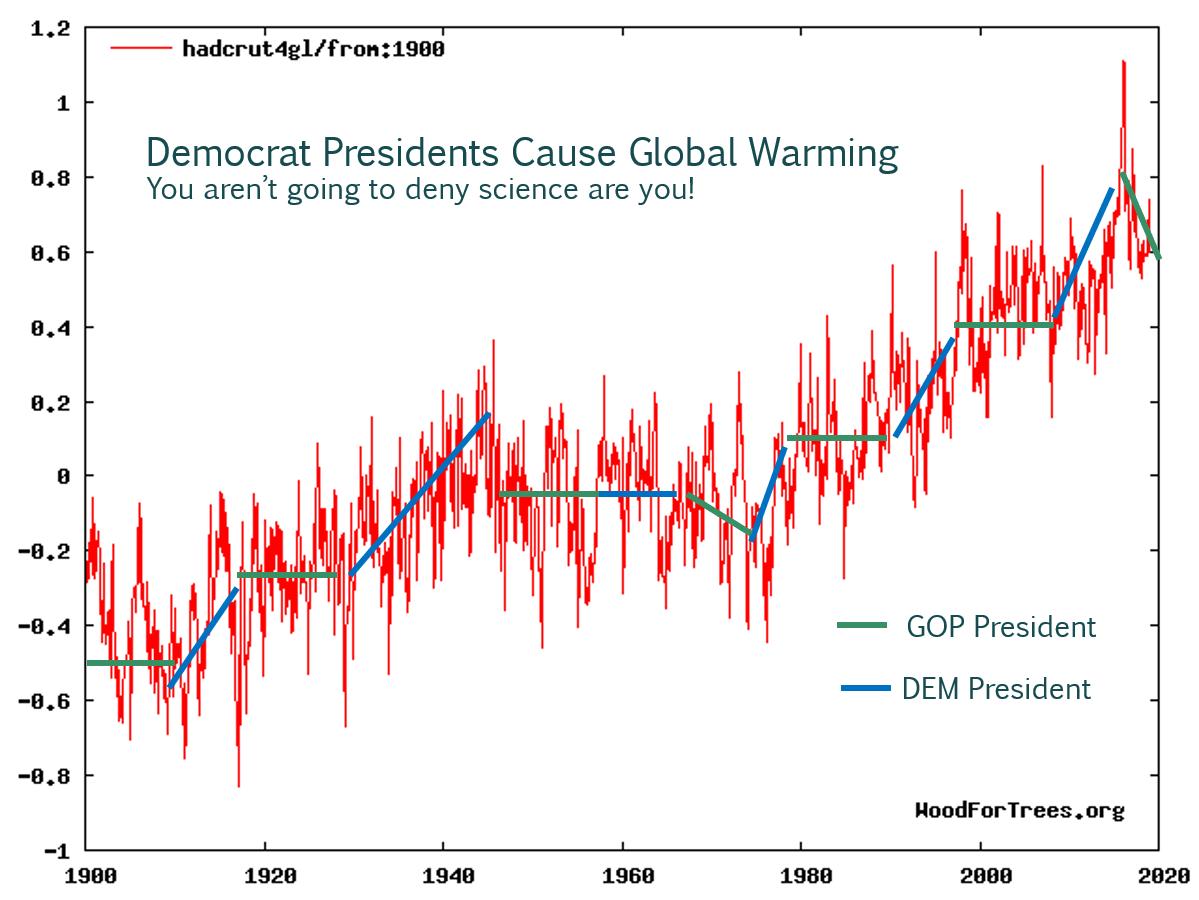
My point made, but not meant to be political.
As to further misuse of correlations.
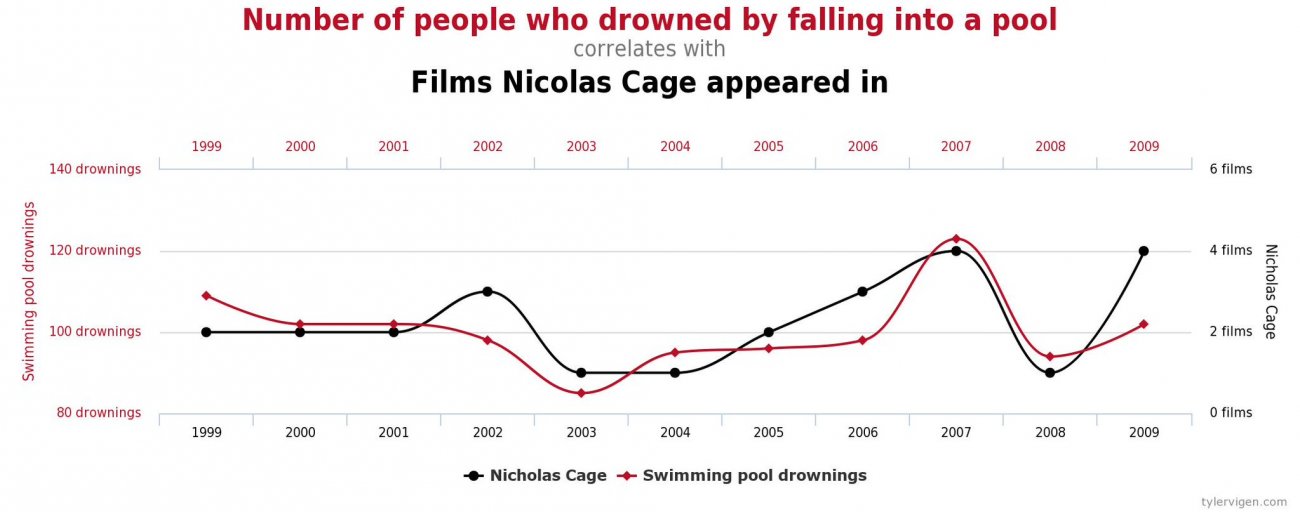
So the problem is we don't have any scientific proof.
_____
As to TomY "climate change" and scientists agree...
If that is true, then why do we scientist keep studying it?
Jim...
BTW the correlation lines shown on the graph are true, but used prove NOTHING.
My point made, but not meant to be political.
As to further misuse of correlations.
So the problem is we don't have any scientific proof.
_____
As to TomY "climate change" and scientists agree...
If that is true, then why do we scientist keep studying it?
Jim...
One more note using the graph that Gene posted.
You can see in that graph that CO2 levels go from around 180 PPM to just under 300 PPM and you can see some correlation to temperature. If you could blow up the time scale, you would see that the CO2 levels are delayed from the temperature change by some hundreds of years.
An amateur (or in some cases intentionally deceptive) conclusion to make is that CO2 levels always follow temperature. CO2 concentration will follow temperature changes when its acting as positive feedback.
But saying CO2 always follows temperature has to ignore the basic way green house gas works. If you increase the concentration of a green house, it will trap more energy which either increases temperature or goes into kinetic energy. When you increase CO2 concentration (like we are currently doing by burning fossil fuel), it acts as a forcing function. In this case, increasing CO2 causes an increase in temp. The CO2 concentration precedes the temperature rise.
Very simple concept.. but its missed particularly be conservative bloggers.
Rather than explain all again, I will repost something I said earlier as this really is a key concept to understand (and please provide a reference if you dont think this is true).
=======================================
A very interesting question is: Does a temperature increase cause an increase in CO2 or does an increase in CO2 cause a temperature increase?
You have to understand a little about feedback and forcing functions. Per the rules hopefully we can follow, here is a reference on the subject https://www.yaleclimateconnections....a-feedback-and-forcing-in-the-climate-system/
CO2 is a feedback mechanism because as temperature rises, the ocean temperature also rises releasing CO2 into the atmosphere. Since CO2 is a greenhouse gas, this is positive feedback because the initial temperature rise caused more greenhouse gas which in turn causes more temperature rise. For CO2 as feedback, the concentration of CO2 will have a time delay compared to the driving temperature change. Ie, CO2 concentration will lag temperature change when its acting as positive feedback.
CO2 can also be a forcing function. If you simply add CO2 to the atmosphere so that its concentration increases, it will cause temperature to rise because it is a greenhouse and traps more energy. When CO2 is a forcing function, the concentration of CO2 will precede the rise in temperature. Ie, as a forcing function, CO2 concentrations leads temperature rise.
Note.. CO2 as a forcing functions seems like a very simple basic concept and I can find many references on this. But you will find conservative blogs that deny this. PLEASE provide a reference if someone does not agree with the simple idea that if you add CO2 to the atmosphere, it will increase the greenhouse effect and cause an increase in temperature. Pretty much the basic definition of what a greenhouse gas does.
Before we came along, CO2 mainly acted as a feedback mechanism and reacted to and amplified temperature change. There is ice core data going back about 800 thousand years that shows a series of glacier and interglacier periods. caused by Milancovitch cycles (reference http://clivebest.com/blog/?p=8656 ). We are currently in a interglacier warm period (a good thing, ice sheets cover a lot of the planet in the cold periods). The ice core data provides both temperature and CO2 concentrations and the temperature always rises first and then the CO2 concentration rises. Temperature falls, then the CO2 concentration falls. CO2 in this case is acting as feedback and it tends to amplify the response to the solar input changes.
But.. something completely different happened when we came along. Unlike in the past where CO2 concentrations were governed by plants and temperature, we started burning fossil fuel which by itself, increased the CO2 concentration in the atmosphere. This is the forcing function of CO2 (do I need more references on this - easy to find) . Very simple green house gas concept. If you increase the green house gas concentration, it will trap energy resulting in a temperature increase. In this case CO2 concentration will LEAD temperature rise.
Last edited: